skip to main
|
skip to sidebar
Monday, December 1, 2008
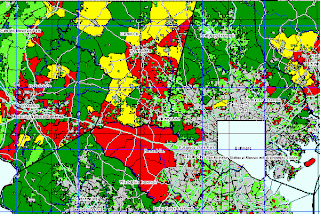
Nominal area choropleth map
gis.esri.com/.../proc97/to200/pap175/p175.htm
A nominal area
choropleth
map does not order or rank the data that it is showing. This map is showing part of Maryland and is giving information on which sections may be impacted by developmental pressure on farmland.
No comments:
Post a Comment
Newer Post
Older Post
Home
Subscribe to:
Post Comments (Atom)
Map Stuff
Blog Archive
▼
2008
(50)
▼
December
(12)
Box plot
Histogram
Parallel coordinate graph
Triangular plot
Windrose
Climograph
Population profile or Population pyramid
Scatterplot
Index value plot
Accumulative line graph or Lorenz curve
Bilateral graph
Nominal area choropleth map
►
November
(18)
►
October
(5)
►
September
(15)
About Me
tbaybuc
View my complete profile
No comments:
Post a Comment