Monday, November 10, 2008

Isobars

www.newmediastudio.org/.../Closed_Isobars.html

An Isobar is a line that is drawn on a weather map to connect points of equal pressure. This map displays close isobars around a low pressure cell. Isobars are a way to describe air pressure.

Tuesday, November 4, 2008

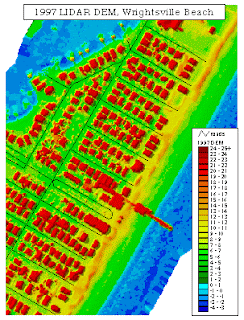
Lidar Map

www.csc.noaa.gov/products/nchaz/htm/intro.htm

Lidar data is remotely sensed data that is detected using Lidar equipment. They are usually collected with mounted laser on aircraft's and can document topographic change on the land and water below. This is an image over Wrightsville Beach in 1997.

Tuesday, October 28, 2008

Doppler Radar image


www.noaanews.noaa.gov/stories/s1192.htm

A Doppler radar image is an image is created by a radar using the Doppler effect to measure radial velocity and microwave signals. It can be used to measure velocity of hurricanes and tornadoes. This is an image over Houston, Texas during Hurricane Claudette in 2003

Black and White Aerial Photo

www.amenfoto.com/.../2006_12_01_archive.php

Black and white aerial photo's are ideal for locating very detail changes in a land's image and shape. This is a photo of different patterns on an island in Sacramento. Black and white is also cheaper to produce.

Sunday, October 26, 2008

Infrared Aerial Photo

http://www.aerialarchives.com/Infrared-Aerial-Photography.htm

Infrared aerial pictures are unique in the fact that they use a spectrum of light to and the filtration of the films to display a photo. This photo is an infrared aerial photo of the Deep Water Channel in Sacramento, California.

Tuesday, October 14, 2008

Remote Sensing-GOOGLE EARTH

http://www.google.com/educators/kml_contest.html

This is a remote sensing map put together by NASA's Jet propulsion laboratory in California. It shows daily MODIS satellite imagery from the previous day. It is used mostly to predict upcoming weather conditions.

Wednesday, October 8, 2008

Cartographic Animation


maps.unomaha.edu/mp/Articles/GISLIS/VisAnim.html

Cartographic animation can be temporal or non temporal and usually creates an illusion of movement or change which is displayed in a series of single frames. This cartographic animation shows Omaha, Nebraska and the percent of population by age group in different areas of the city.